MLB Run Line Betting Strategy: Beating the ±1.5 Spread
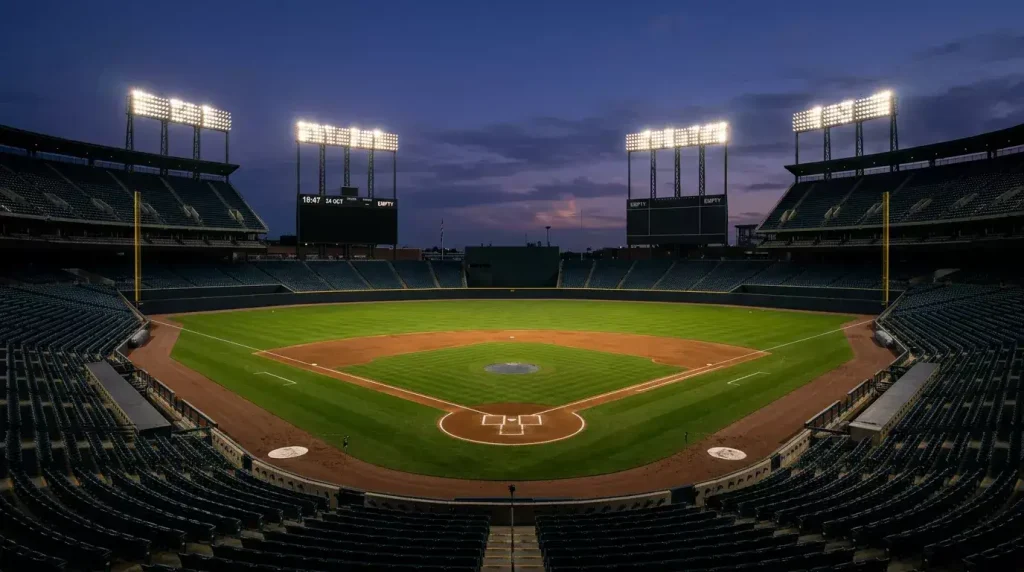
Defining the ±1.5 MLB Run Line Spread
The first time I tried to explain the run line to a friend in a pub in Camden, he stared at me like I had asked him to read a tax return in Mandarin. He had backed Liverpool that afternoon on a -1 handicap and won by two. Surely, he said, the same thing in baseball was just the spread? Half right, and that half is exactly what trips up most UK punters who wander into MLB markets expecting football logic to carry them.
The MLB run line is a fixed spread of one and a half runs. The favourite is laid at -1.5, meaning that side has to win by two runs or more for the bet to settle as a winner. The underdog gets +1.5, which pays out whenever that team either wins outright or loses by exactly one run. The number is locked. It does not move to -2.5 because a starting pitcher is an ace, and it does not retreat to -0.5 because the underdog has lost eight in a row. The only thing that moves is the price beside the number.
That fixed line is the entire reason this market is hard. Football and basketball spreads breathe with the matchup, so the price hovers near even money on both sides. MLB run lines do not breathe. They snap. A heavy favourite at -1.5 might be 2.10 in decimal odds, while the same team’s moneyline sits at 1.45. The underdog at +1.5 might come back at 1.75, against a moneyline of 2.85. The gap looks generous until you notice why it exists.
Roughly 28% of MLB games end with a one-run margin, and that percentage is the silent landlord on every run line ticket you ever buy. About 2,430 regular-season games go onto the board each year across the 30 clubs, and on average something close to 680 of them are decided by the smallest possible difference. Every one of those games settles the moneyline favourite as a winner and sends every -1.5 ticket on that favourite straight to the rubbish bin. Forty minutes of perfectly correct analysis vaporises because a relief pitcher allowed a sacrifice fly in the eighth.
The run line is therefore a market priced for a sport where the most common winning margin is exactly the worst possible result for the favourite-backer. UK punters used to football, where a one-goal cushion feels like a comfortable safety net, walk in and get robbed. The price compensates. Whether the compensation is enough is what the rest of this guide is for.
Once you master the standard spread, exploring MLB alternate run lines can help you trade probability for much better prices.
How the ±1.5 spread is priced
Here is the thing nobody tells you when you first open a baseball price page: the run line and the moneyline are different ways of saying the same fact. The book has a probability it believes in for the favourite winning by exactly one run versus winning by two or more. It bakes those two probabilities into separate lines, charges its margin on both, and lets you choose which side of that internal forecast you want to fade.
Say the book thinks a starting pitcher’s club wins the game 62% of the time. Naive moneyline maths gives a fair decimal price of 1.61. The book lays it at 1.50 and pockets the difference as overround. Now suppose the same model says when that club wins, they win by two or more runs in 56% of those wins. Multiply 0.62 by 0.56 and the modelled probability of covering -1.5 is roughly 34.7%. Fair decimal is 2.88. The book offers 2.10. The gap there is wider in percentage terms than on the moneyline, because the book is also pricing in the fact that one-run wins happen often enough to gut the favourite-backer who tried to be clever.
What this means in practice is that the run line is not a discount on the moneyline. It is a different bet entirely, one that asks not just “who wins” but “by how much”. The two questions correlate strongly, but the second one is meaningfully harder. The book knows it is harder, so the markup is built in. When a punter sees -1.5 at plus money and feels they are getting a bargain, they are reading the price relative to the wrong baseline.
Pricing also leans heavily on the starting pitcher, the bullpen depth behind them, and the run-environment of the park. A 0.85 starting-pitcher SIERA against a club with a lineup full of strikeout candidates pulls the -1.5 price tighter. A bullpen that has thrown three days in a row pushes the same price out, because late-inning leads no longer feel safe. The full reasoning behind those inputs lives in our pitcher matchup analysis, but the short version is that pricing depends heavily on the starting pitcher, and any run line read that ignores them is reading half a card.
One more wrinkle. The run line is not the only spread you will see. Alternative run lines exist at -2.5, -1.5, +1.5, +2.5, and so on, each with its own price. The standard ±1.5 is the one the market trades most heavily and the one used in any meaningful sample of public ATS records. If you stray from it, you are leaving the deep market for a thinner pool where the book’s margin tends to widen, not narrow. That is fine if you have a specific read. It is not a place to wander.
The 28% problem: one-run games as a structural drag
Early in my MLB tracking days, I went through a notebook trying to figure out why my -1.5 picks kept losing on nights when the favourite obviously won. I had picked the right teams. I had read the matchups correctly. And yet a third of my tickets vaporised because the game ended 4-3, or 2-1, or 6-5. I was not unlucky. I was being taxed by a structural feature of the sport.
About 28% of MLB games conclude with a one-run margin. Some seasons that number drifts to 27%, others to 30%, but the centre of gravity sits between those two posts year after year. The reason is not exotic. Baseball is a low-scoring sport where the average game total hovers around eight or nine combined runs. The trailing club, even when clearly outclassed, almost always gets one more turn at bat. They use it. A late single, a walk, a sacrifice fly, and what looked like a comfortable -1.5 cover becomes a one-run game that pays nothing.
Multiply 28% across a 2,430-game regular season and you get roughly 680 games in which the moneyline favourite wins by exactly the score they cannot afford to win by. Every one of those 680 games is a -1.5 ticket that landed in the bin while the punter who took the same side on the moneyline collected. That is not a small leak. That is a structural disadvantage built into the entire favourite-run-line strategy, and it is the single biggest reason this market eats novices alive.
The asymmetry has a quiet flip side. Every one-run game that punishes a -1.5 backer rewards a +1.5 backer who took the underdog. That is why +1.5 on a clear underdog so often comes back at short price like 1.45 or 1.55 — the book has already done the arithmetic. Underdogs that go on to lose by exactly one run cash the +1.5 ticket. Underdogs that win outright cash it twice as comfortably. The book builds both outcomes into the price, and the resulting line is rarely as cheap as it looks.
Long-term sample sizes confirm the picture. Across roughly a decade of regular-season baseball, favourites win on the moneyline in the neighbourhood of 56% to 57.5% of games. Underdogs land 4 wins out of every 9 on a fairly stable basis. Those numbers sound bettor-friendly until you remember the juice. A pure favourite-moneyline strategy without filters loses money long term because the book’s vig eats the modest edge. The run line redistributes that vig in a way that punishes the favourite-backer even harder, because the favourite has to clear two hurdles instead of one.
The takeaway is not “never bet -1.5”. The takeaway is that you need a reason to take -1.5 that goes beyond “this team is good and one and a half runs feels small”. The reason has to be quantitative, and it has to factor in the bullpen depth, the park, and the lineup matchup against the opposing pitcher. Otherwise you are paying the 28% tax for nothing.
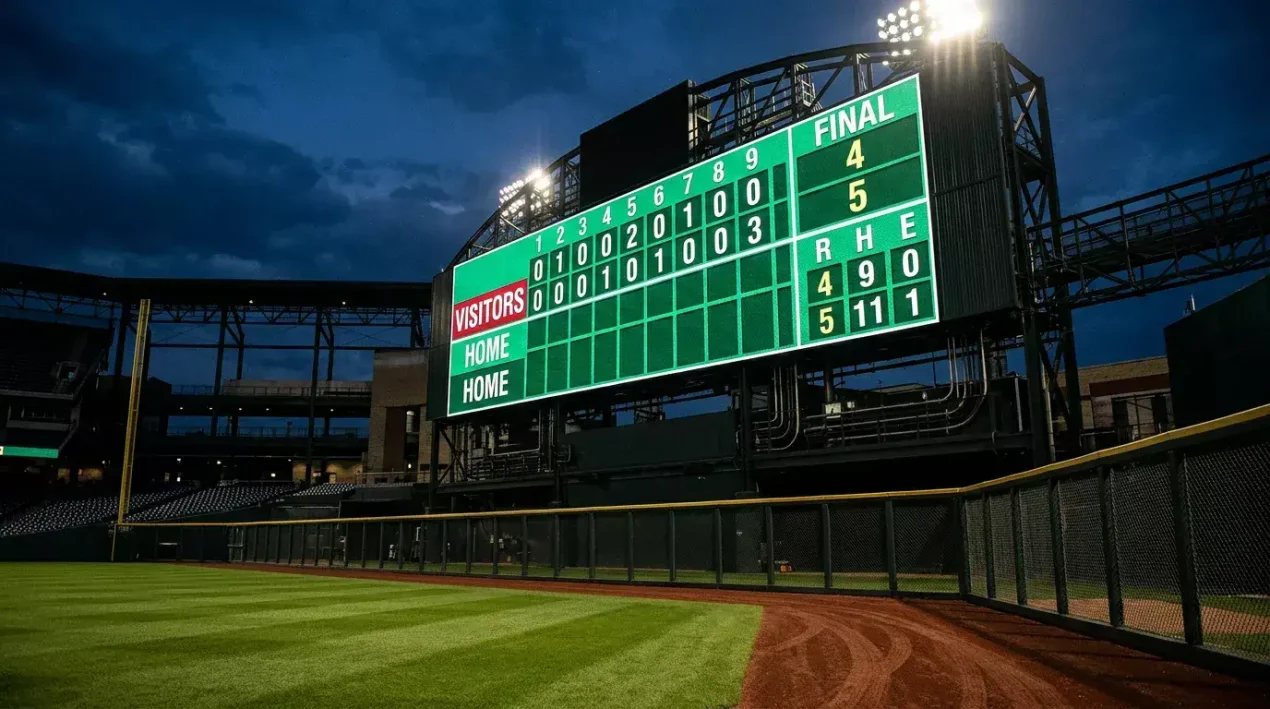
Comparing the run line and the moneyline: a side-by-side
Imagine the same game priced two ways. The home team is a -160 favourite in American odds, which converts to 1.625 in decimal. Their run line is -1.5 at 2.10. The visiting underdog is +140 on the moneyline, which is 2.40 in decimal. Their run line is +1.5 at 1.75. Same matchup. Four different prices. Which one represents the best route into the game?
The moneyline asks one question: who wins. The run line asks two: who wins, and do they win by enough. Across a long sample, the moneyline-favourite resolves around 56 to 57.5% of the time, the moneyline-underdog grabs roughly 43 to 45% if you net out the vig. Those are the raw outcomes the entire market is priced from. The run line then redistributes those outcomes according to margin.
If a punter took -1.5 on every favourite at a typical 2.10 price for a full season, they would need roughly 47.6% strike rate to break even. The actual hit rate sits closer to 40-43% in most samples, which is why blind favourite-run-line betting is a slow leak. The same punter taking +1.5 on every underdog at 1.75 would need a 57% strike rate. They typically clear that bar, because every underdog one-run loss counts as a win. The break-even maths flips the apparent attractiveness of the two sides.
This is where Rob Manfred’s framing of the wider environment matters. The MLB commissioner has been blunt about how the sport sits inside the modern betting landscape: “We didn’t ask to have legalized sports betting. It kind of came, and that’s the environment in which we operate now. We don’t have a lot of choice about that.” That environment is one in which every market is priced sharply by sophisticated bookmakers, including the run line. The notion that there is some easy gap waiting on plus-money -1.5 tickets misreads the market.
The cleaner mental model is this. Use the moneyline when your read is “the better team will probably win”. Use the run line when your read is more specific: “the better team will not just win, they will win by enough that a late underdog rally cannot threaten the spread.” Those two reads are not the same thing, and the price gap between the two markets is the book charging you to make a more confident claim.
Taking the favourite at -1.5
The favourite at -1.5 is the most popular run line play and statistically the worst one when bet without filters. The structural 28% one-run-game tax cuts into the cover rate every season. To take -1.5 with any sustainable edge, three conditions usually need to align.
The first is a meaningful pitching gap. A starting pitcher who projects to give up two runs in seven innings against a starting pitcher who projects to give up five runs in five innings creates a natural three-run cushion before the bullpens enter. Without that gap, -1.5 is a coin flip dressed up in plus-money clothing.
The second is bullpen depth. A favourite carrying a tired or thin relief corps cannot hold a two-run lead in the late innings reliably. Late innings are where one-run games are manufactured. If the bullpen has thrown 4 innings across the previous two days, the late-inning save percentage drops in a way the opening price often does not fully reflect.
The third is the right park. Pitcher-friendly venues with deep gaps and heavy air suppress scoring across both lineups, which lowers the variance and makes it easier for the better team’s run differential to express itself. Hitter parks at altitude or with short porches inflate the chance of a late underdog rally that compresses the margin to one run.
When all three line up, -1.5 at plus money is a legitimate play. When only two are present, it is a gamble. When only one is present, the moneyline is almost always the better route.
Taking the underdog at +1.5
The underdog at +1.5 is the run line bet that survives blind staking better than any other side, and home underdogs are the strongest sub-set within it. The 2025 season made the point with unusual clarity.
Home underdogs in MLB across 2025 hit a 45.9% outright win rate, which is well above their implied moneyline probability and translates into a strong +1.5 cover rate once the one-run losses are added back in. Road underdogs landed only 33.1% outright, which is a sharper drop than the home-road gap in most major sports. The Mets covered the run line at 85.7% during a stretch of 2025, and the Mariners hit 80% over a similar window. Those numbers are not sustainable, but they show what the home-underdog edge looks like when it runs hot.
The mechanics behind it are clean. Home teams bat in the bottom of every inning, including a potential bottom of the ninth. If the road favourite leads by one or two heading into the final frame, the home underdog has one more turn at bat to either win outright or close the gap to one. Both outcomes cash the +1.5 ticket. The same game, played in reverse with the underdog on the road, often ends 3-1 instead of 3-2 because the road underdog does not get the same final at-bat asymmetry.
The price you pay for +1.5 on a clear underdog is the inverse of the favourite -1.5 issue. The book has already worked out the maths, so the line tends to compress to something like 1.45 to 1.65. That tighter pricing strips most of the edge unless your specific read is sharper than the market’s. Sharper reads usually come from one of three places: a starting-pitcher mismatch the market has under-priced, a bullpen advantage on the underdog’s side, or a park environment that favours low-scoring games where one-run margins are likely.
Which 2025 teams covered the run line — and which collapsed
Looking at any season in retrospect is the easiest analysis in sports betting. The numbers all sit there, beautifully ordered, suggesting patterns that may or may not survive into 2026. With that warning attached, the 2025 ATS picture still tells you something useful about how the run line behaves in the real world.
The headline at the top of the season was the World Series between the Toronto Blue Jays and the Los Angeles Dodgers. Both clubs reached the final stage in part because their underlying run differentials translated into run-line covers across long stretches of the regular season. Dodgers backers on -1.5 spent most of the summer cashing tickets at home against weaker National League West opposition, where the rotation was good enough and the lineup deep enough to push margins past two runs even in low-scoring matchups. The Blue Jays did similar work in the American League East with a less spectacular roster but a steadier bullpen.
The Mets and the Mariners both had stretches in 2025 where their run-line cover rate climbed into the 80% range — figures I cited a few sections ago to make the home-underdog point. Neither club finished the year at those rates, because nobody does. The Mets sequence coincided with a deep starting rotation that suppressed opposing scoring; the Mariners sequence coincided with a hot home schedule against weak offensive opponents. Both runs ended when the underlying conditions normalised, which is the lesson worth taking forward: hot run-line stretches are usually riding two or three specific underlying factors, and the moment those factors fade, the cover rate snaps back to something near 50%.
The collapses are less talked about but more instructive. Clubs that started the season carrying high run-line expectations because of marquee pitching signings often disappointed once the rotation stopped throwing seven innings a start. Bullpen-dependent teams especially struggled to convert -1.5 tickets, because one-run leads in the seventh inning were no longer safe by the eighth. A favourite that wins 2-1 cashes the moneyline and loses the run line, and 2025 produced an unusually high number of those late-margin compression games.
What this means for 2026: do not assume the team that crushed run lines last year will keep doing it. Look instead at the underlying conditions. A club entering the season with a top-five projected SIERA across the rotation, a bullpen depth chart that is six pitchers deep, and a balanced lineup that punishes opposite-handed pitching is more likely to produce run-line covers than a club that ran hot in 2025 on the back of two specific starters and a closer who has since been traded.
The integrity landscape sits over all of this, too. The Clase and Ortiz indictments late in 2025, combined with the lifetime ban handed to Tucupita Marcano in 2024 and the umpire dismissals, shifted how sportsbooks price certain pitcher-specific markets. Run-line pricing was not directly affected, but reliever-specific micro-bets that fed into in-play run-line liquidity were capped at 200 dollars per ticket and stripped from parlay menus. Less noise in the late-innings market means slightly cleaner closing-line value on the standard run line — but only marginally.
Five mistakes UK bettors make with the run line
Most of these mistakes I have made myself, in the same week, more than once. They are not signs of stupidity. They are signs of someone who has not yet absorbed the way the maths of this market actually works. Read them in the spirit they are offered.
The first mistake is treating -1.5 as a discount on a heavy favourite. A -250 moneyline price feels expensive, so the punter looks at -1.5 at 2.10 and thinks they have found value. They have not. The 2.10 price is the book’s honest estimate of how often that favourite wins by two or more, and the implied 47.6% break-even rate is roughly where the long-run cover sits. Buying -1.5 because the moneyline price feels heavy is paying for the privilege of needing two hurdles cleared instead of one.
The second is taking +1.5 on heavy road underdogs at short price. The 2025 numbers above show why this is a trap. Road underdogs win outright at 33.1%, a much lower rate than home underdogs at 45.9%, and the book prices +1.5 across both contexts. A road dog at +1.5 priced at 1.45 needs roughly a 69% cover rate to break even. The market is not generous enough to leave that on the table consistently.
The third is ignoring bullpen rest days. The run line lives or dies in the late innings. A favourite at -1.5 with a fully rested bullpen behind a six-inning starter is a fundamentally different bet from the same favourite with the closer on his fourth consecutive appearance. Bullpen fatigue collapses two-run leads into one-run leads with depressing regularity, and the opening run-line price almost never accounts for it fully. UK punters who do not have time to check rest charts in the afternoon are flying half blind.
The fourth is the alternative-line wander. Books offer -2.5, -1.5, -0.5, +0.5, +1.5, +2.5 and sometimes more. Each of those alternative lines has a thinner market and a wider book margin. A punter who decides “if -1.5 is overpriced, I will take -2.5 at bigger plus money” is moving from the deepest market on the slate to a much thinner one. The overround on the alternative lines is usually 8-12% versus 4-6% on the standard run line. That is not where to fight for edge.
The fifth is parlaying run lines. Combining three -1.5 favourites into a treble feels like a sharp move because each leg pays plus money. It is mathematically the same as compounding the worst margin in baseball three times. The implied break-even rate for a treble of three -1.5 lines at 2.10 is roughly 11%, and the book applies its margin on every leg. Multiple run-line bets across different games make sense as separate singles. Stacked into one ticket they are a stealth casino product.
For daily insights and comprehensive strategies, always consult the top UK baseball betting guide before placing your wagers.
One last word before you click confirm
The run line punishes punters who treat it as a casual second cousin of the moneyline. It rewards punters who treat it as a different bet with its own maths, its own risk profile, and its own situational filters. The 28% one-run-game rate is not going anywhere, the bullpen-late-innings dynamic is not going anywhere, and the home-underdog asymmetry has shown up in long enough samples that it deserves respect rather than scepticism.
If you are starting out with MLB in the UK, my honest advice is to leave -1.5 alone for the first month. Bet the moneyline on day games where the lineup is confirmed and the matchup is clear. Watch the run line settle alongside your moneyline picks, note the games where the favourite wins by exactly one run, and feel that 28% in your bones rather than as a number on a page. After a month, the maths in this guide will make practical sense, not just intellectual sense. Then, and only then, start looking at +1.5 underdog plays at home, where the structural edge actually lives.
Is the run line just a baseball version of the point spread?
Mechanically yes, structurally no. The run line is a fixed ±1.5 spread, which makes it look like a football or basketball point spread, but it never adjusts to the matchup. Only the price beside the line moves. That fixed nature, combined with the fact that 28% of MLB games end with a one-run margin, gives the run line a risk profile no other major-sport spread shares.
Why do plus-money run lines on heavy favourites appear so often?
Because the book has done the arithmetic on how often that favourite wins by exactly one run, and that scenario kills the -1.5 ticket. The plus-money price on -1.5 is not a generosity; it is the book’s accurate estimate of cover probability. A favourite priced at -200 on the moneyline routinely shows up at 2.10 to 2.30 on -1.5, and the long-run cover rate sits close to the implied break-even figure that price suggests.
Does taking the +1.5 underdog actually beat the vig long-term?
It depends entirely on which underdog and where. Home underdogs hit 45.9% outright in 2025 and covered +1.5 at a strong rate once one-run losses are added back in. Road underdogs hit only 33.1% outright and rarely beat the price on +1.5 once the book’s margin is applied. Blanket +1.5 betting across all underdogs loses money. Filtered +1.5 betting on home underdogs with specific matchup advantages clears the vig in most samples.
This material was created by the DiamondEdge team.
Related posts
MLB Betting and UK Tax: What Punters Actually Need to Know

MLB Public vs Sharp Money: Reading the Line Movement