MLB Park Factors: Adjusting Bets for Stadium Dimensions
Hitter vs Pitcher Parks: Applying Stadium Metrics to Totals
Watch the same MLB lineup play a four-game home series at Coors Field and then a four-game series at Oracle Park, and you would swear they were two different teams. The same hitters who blasted nine home runs in Denver suddenly cannot lift a ball over the right-field fence in San Francisco. The starting pitcher who got tagged for fourteen earned runs in three Colorado starts spins six innings of two-run ball in his next outing by the Bay. The slugger goes 2-for-15. The ace looks human again.
None of that is randomness. It is altitude, dimensions, foul-territory size, wind off the water, the density of the air, and a dozen other things that vary park to park and that the totals market knows about. The bookmaker has priced every one of those variables into the over/under for the night, which is why blindly betting “high-scoring team should hit overs” is one of the fastest ways to give an MLB sportsbook your money.
For a UK bettor coming to baseball, park factors are one of the most underrated edges available. The football pitches you grew up watching are essentially identical from ground to ground. The MLB landscape is the opposite – thirty stadiums, no two the same, and the differences between them are big enough to move the totals line by a full run in some matchups.
What a park factor actually measures
A park factor is a single number that compares run-scoring at one ballpark to the league average. A park factor of 100 is exactly average. Above 100 is a hitter’s park; below 100 is a pitcher’s park. A factor of 110 means roughly 10% more runs are scored at that venue than at an average MLB park; a factor of 90 means roughly 10% fewer.
The calculation is more careful than just “runs per game at this stadium”. It controls for the quality of the teams playing there. A stadium where the home team has a terrible pitching staff would record more runs than average even if the venue itself was neutral. Park factors strip that out by comparing how the same teams score at this park versus on the road. The resulting number is closer to a pure venue effect.
The most important nuance: park factors are not one number per stadium. They are a vector of numbers – one for runs, one for home runs, one for hits, one for left-handed power, one for right-handed power, and so on. Coors Field is famously the most extreme run-scoring environment in the league, but its home run factor is not as extreme as its overall run factor because singles and doubles also jump in the thin air. Oracle Park suppresses home runs more than it suppresses runs because of the deep right-centre field gap that turns warning-track fly balls into outs.
For UK punters this matters because the over/under market is priced on total runs, not on home runs specifically. A “low” park factor like Oracle Park might still post overs at a normal clip if the home team scores via the gap-doubles that the park rewards. The signal from park factors is real but it is layered.
The hitters’ parks and the pitchers’ parks
Three stadiums have run-factors so extreme they almost shape their own betting markets. Coors Field in Denver, where 5,200 feet of altitude reduces air density and turns routine fly balls into home runs. Globe Life Field in Texas, where the retractable roof traps heat and humidity that carry the ball. And historically Fenway Park in Boston, where the short left-field wall – the Green Monster – distorts left-right hitting splits in a way no other stadium does.
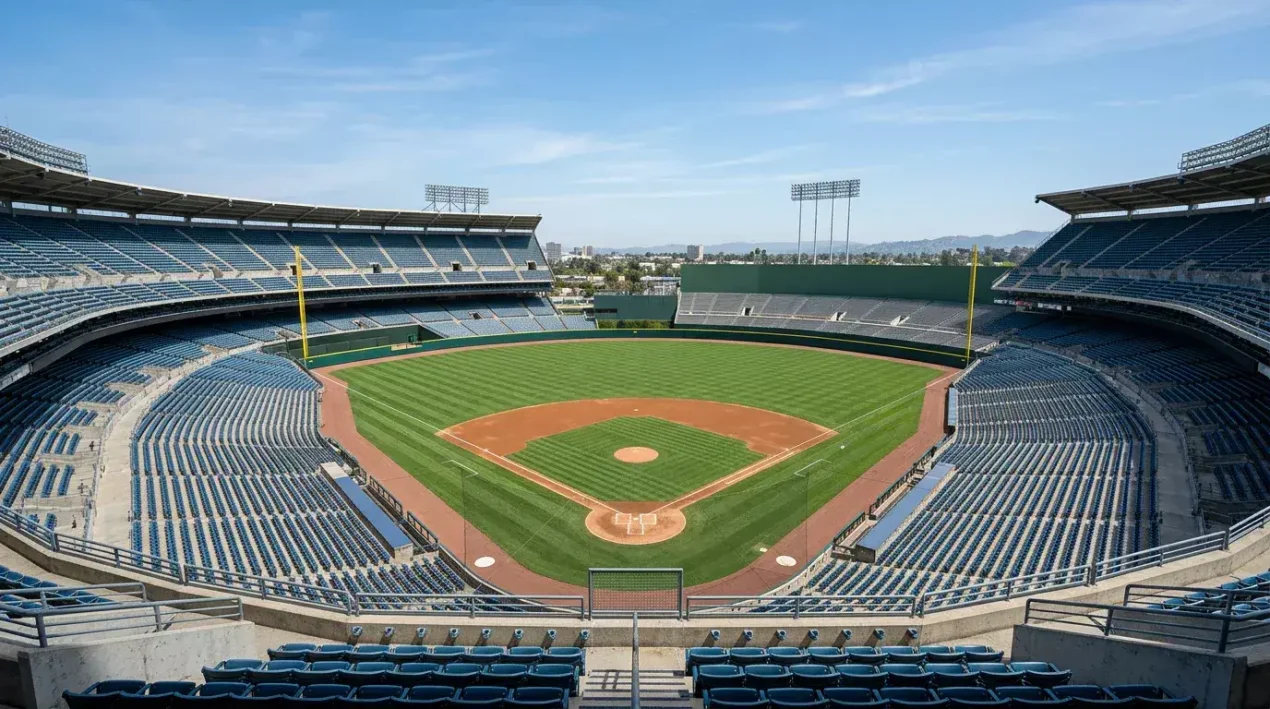
At the other end, three parks suppress scoring almost as reliably. Oracle Park in San Francisco – the wind off the bay, the deep right-centre, the marine layer that thickens the air at night. Petco Park in San Diego, with the marine layer effect and the deep dimensions that turn would-be doubles into outs. And T-Mobile Park in Seattle, where the marine air and the high right-centre fence both work against fly balls.
The market knows all of this. Open any totals line for a Coors Field game and you will see numbers like 11.5 or 12.5 – figures that look enormous compared to the league average around 8.5-9. The market has already priced in the altitude. Open the same line for a Petco Park game and you might see 7.5 or 8. The market has already priced in the marine layer.
The edge does not come from knowing that Coors plays high. The market knows that. The edge comes from knowing when the totals line has not adjusted enough – or too much. A 12.5 at Coors with two soft pitchers and the wind blowing out can still play under if there are factors the market underestimated. An 8 at Petco on a hot dry evening with the wind blowing out can still play over for the same reason. Park factors are the baseline; weather and matchup are the modifier.
Applying park factors to the totals market
The practical workflow is short. Before checking the totals line on a game, write down what you think the run expectation should be for the matchup, ignoring the park. Two solid starting pitchers, average lineups, full health – your prior might be 8.0 runs. Now adjust for park. Coors Field park factor 115 means multiply by 1.15, giving 9.2. Oracle Park park factor 88 means multiply by 0.88, giving 7.0.
Compare your park-adjusted number to the posted line. If you arrived at 9.2 and the line is 10.0, the market thinks the matchup is hotter than you do – possibly because of an injury or a weather factor you missed, possibly because the line is shaded by public action towards overs. Do the work to figure out which.
The more honest way to use park factors is asymmetrically. Use them to confirm overs at extreme hitters’ parks and confirm unders at extreme pitchers’ parks. Be slow to take an under at Coors or an over at Petco against the grain of the park, because you are fighting a thirty-game park-factor sample with whatever ad hoc analysis you have done that day. The base rate of the park is hard evidence; your matchup read is softer.
One more application: alternate totals. The standard totals line is heavily bet and sharply priced. Alternate totals – Over 10.5 instead of the main 9, for example – are bet less often. When park-factor extremes combine with matchup factors that push in the same direction, the alternate-totals line can lag. A double-extreme scenario (Coors Field plus two weak bullpens plus 90-degree game-time temperature) might genuinely warrant an Over 11 bet at a price that under-reflects the combined effect.
How parks change month-to-month
Park factors are usually quoted as full-season figures, but the underlying physics changes substantially across the calendar. April baseball is cool. July baseball is hot. October baseball is cool again. Cool air is denser than warm air, which means the ball does not carry as well. The same park can play noticeably differently in May than in August.
The size of this effect varies by stadium. Indoor parks with controlled climates – Tropicana Field, Globe Life Field with the roof closed, Chase Field with the roof closed – barely change month to month. Outdoor parks in temperate climates – Wrigley Field, Fenway Park, PNC Park – change a lot. The Cubs play home games in Chicago that feel like two different leagues between April and July, and the totals lines move with that pattern.
Wrigley Field has the additional wrinkle of wind. When the wind blows out to centre at Wrigley in summer, the park plays as a top-five hitter’s park. When the wind blows in from the lake on a cool afternoon, the same park can play as the most pitcher-friendly venue in the league. Same dimensions, same altitude, totally different outcomes. Bookmakers price this, but they price it from forecast wind speeds posted an hour before first pitch. Wind on the day can deviate, and that deviation is sometimes where the totals edge lives – a connection worth chasing further in our forecast-driven approach to MLB totals.
A practical heuristic: in April and October, give pitchers an extra 5-7% credit at outdoor parks. In July and August, give hitters the same. The full-season park factor obscures these effects. Bettors who account for them have a small but real edge over the average market participant.
The park factor as the floor, not the ceiling
I will leave you with the framing I use on every totals bet. The park factor is the floor of the analysis – the baseline that tells you whether you are dealing with a 7-run venue or a 11-run venue. It is not the ceiling. The ceiling is built from pitching matchup, lineup health, weather forecast, umpire tendency, and bullpen state. Without the floor you have no idea what kind of game you are pricing. Without the ceiling you have no edge. Both layers matter and both layers have to be present in your analysis before you put a stake down. Bettors who only look at park factors find themselves backing overs at Coors regardless of who is pitching, which is a textbook way to lose money. Bettors who never look at park factors find themselves applying the same totals logic to Petco and Coors as if they were the same venue, which is even worse. The skill is in stacking both layers consistently, every night of the season, and letting the spreadsheet tell you which kinds of stacks actually produce CLV over time.
Are park factors stable from year to year?
The extreme parks (Coors, Petco, Oracle) are quite stable across seasons because their underlying causes – altitude, dimensions, marine air – do not change. Mid-range parks can shift more, especially when dimensions are altered or playing surface is replaced. Use three-year rolling averages where possible.
Does humidor use at Coors change the equation?
Yes, partially. The Coors humidor mitigates the extreme run-scoring of the pre-2002 era, bringing the park closer to merely very high rather than absurdly high. Modern Coors Field still produces the highest park factor in MLB but the gap to second place has narrowed.
This material was created by the DiamondEdge team.
Related posts

MLB Betting and UK Tax: What Punters Actually Need to Know

MLB Public vs Sharp Money: Reading the Line Movement