
MLB Stolen Base Props: Betting on Player Speed
 Available in US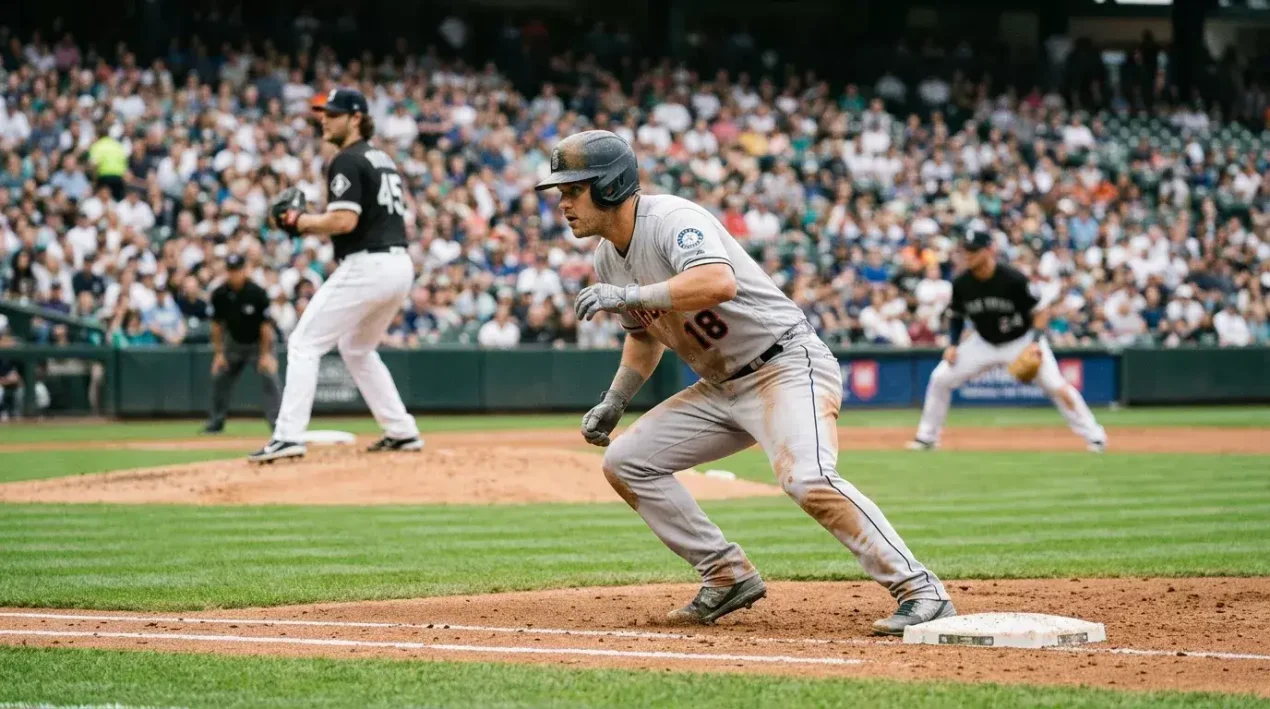
Rule Changes and Pop Times: Evaluating Stolen Base Markets
For most of MLB history the stolen base was a niche play, mostly the property of a handful of specialist baserunners. Then in 2023 the league installed bigger bases (going from 15-inch to 18-inch squares), restricted pickoff attempts by the pitcher, and introduced the pitch clock. The combined effect on the running game was immediate and substantial. Stolen base totals jumped league-wide. The success rate on attempted steals jumped along with them. The market for stolen base props, which had been a quiet sidebar, became a real betting opportunity.
Three seasons after those rule changes, the running game has settled into a new equilibrium that is meaningfully different from the 2010s baseline. Speed players who used to attempt 25-30 steals a year now attempt 40-50. Players who never ran are now running. Pitchers who once held runners well have lost meaningful effectiveness, and catchers whose throwing arms used to suppress steal attempts have lost a degree of intimidation. The market has adjusted, but the adjustment is still ongoing – and that ongoing recalibration is where the betting opportunities live.
I watch the stolen base prop market closely because it is one of the few MLB prop markets where individual player edges remain robust across seasons. Pitcher quality and pitcher type matter enormously. Catcher arm matters. Game state matters. Manager tendencies matter. The market prices all of these, but it prices them imperfectly enough that disciplined research can find consistent value.
The prop structure: anytime or over/under
UK bookmakers typically offer two structures for stolen base props. The first is “anytime steal” – a binary bet on whether the player will steal at least one base in the game. The second is “over/under” on a specific number of total bases attempted or successfully stolen across all baserunners in a game, sometimes broken down per team.
The anytime structure is the more bet-friendly market because the binary outcome resolves clearly and the price reflects implied probability transparently. A speed player priced at 2.80 decimal to steal a base anytime in a game has implied probability of 35.7%. Whether that probability is fair depends on the player’s expected stolen base attempt rate (driven by their on-base probability, their typical attempt rate when on base, and the matchup factors).
The over/under structure on total bases is harder to bet because the outcome depends on multiple players. The line might be set at over/under 1.5 stolen bases in a game. The bookmaker has calculated this from the expected attempts and success rates of all the runners likely to reach base. The bettor’s analytical work is more complex – you are pricing a team-level total, not an individual player.
The bookmaker’s margin on anytime steal props is typically 10-15%, comparable to other player prop markets but lower than HR props. The margin on team total stolen base props is similar. Both markets are bet-able with sufficient research; neither is a market where casual flier bets pay off without analysis.
The inputs that move the line
Five inputs dominate stolen base prop pricing. Player’s seasonal attempt rate and success rate. Opposing pitcher’s hold quality. Opposing catcher’s pop time (the time from the catcher receiving the ball to the throw arriving at second base). Game state expectations (close games encourage steals, blowouts discourage them). Player’s recent health and form.
Player attempt rate is the foundation. A player attempting 50 steals across 162 games is attempting roughly 0.31 per game. After adjusting for the probability they reach base in any given game (typically 35-40%), their per-game attempt probability is roughly 0.10-0.12 – meaning roughly 10-12% probability of attempting at least one steal per game. Success rate then converts attempts to successful steals; a 75% success rate player turns 10% attempts into 7.5% successes per game.
Opposing pitcher quality matters enormously. Some pitchers have demonstrably elite holding ability – fast move times to first, deceptive pickoff motions, slide step deliveries that reduce time to home plate. Others give runners a full second of extra time. The pop time of the catcher then converts that pitcher-allowed lead into successful or unsuccessful steals. A pitcher with 1.45-second hold time and a catcher with 1.90-second pop time allows steals at a substantially higher rate than a pitcher with 1.30-second hold time and a catcher with 1.85-second pop time.
Game state is the input that the bookmaker prices least well. A close game in the seventh inning with a tying run on first base creates dramatically higher stolen base probability than a blowout in the second inning. The market prices the average game state, but individual game states deviate from average. Late close games drive more steals; mid-inning blowouts drive fewer. Bettors who can read live game state and identify pre-game prop bets where the projected game state is conducive to running have a structural edge.
The pickoff rule and what it actually changed
The 2023 rule restricting pitchers to two disengagements per plate appearance fundamentally changed the pickoff game. Before the rule, a pitcher could throw to first base as many times as he liked, wearing out the runner’s lead and eliminating jumps. After the rule, the third disengagement either has to result in an out (pickoff) or the runner is awarded the base.
The practical effect: pitchers throw to first base less frequently than before, runners take bigger leads, and stolen base attempts succeed at higher rates. League-wide stolen base success rate climbed from approximately 76% in the years before the rule change to approximately 80% in the seasons after. That four-percentage-point shift translates to meaningful differences in expected value on stolen base props.
The shift particularly favoured average-speed runners. Players who could not steal effectively before the rule change because pitchers could disrupt their leads now find themselves with enough runway to succeed. The bottom-tier speed players now attempt 8-12 steals a year where they once attempted 2-4. The market has priced this shift but not always with full precision on the individual player level.
The opposing adjustment from pitchers has been mixed. Some pitchers have improved their slide step delivery, reducing time-to-home from 1.45 to 1.30 seconds. Others have shifted toward more out-pitches to the catcher, accepting that they cannot manage the running game and focusing on getting outs at the plate. The split between these adjustment strategies creates differential matchup quality for runners. The bettor who knows which pitchers have adapted well and which have not has a meaningful edge on individual stolen base props.
Identifying the steal-prone game state
The pre-game stolen base prop is priced on average game state expectations. But individual games deviate substantially. A close late-inning game with the tying run on first base creates 3-4x the stolen base probability of an average inning. Bettors who can identify games likely to enter that high-leverage state have a structural edge.
Three indicators are useful. First, low total games. A game with a totals line of 7.5 or lower is likely to be close throughout, which means the running game becomes more relevant. The runners are more likely to be on base at strategic moments. The team trailing by one or two will run more aggressively to manufacture runs. The pre-game total is a useful proxy for the expected leverage of the running game.
Second, divisional matchups. Teams within the same division have managers who know each other’s tendencies. The manager facing a known aggressive baserunning team will pitch out, will deploy the pickoff move, will use the slide step. The strategic chess game increases the variance of running outcomes and creates spots where the market has not fully priced the matchup.
Third, pitcher type. A pitcher who relies heavily on the slider or curveball as a primary pitch tends to give up more steal opportunities because of the longer delivery time to home plate. A pitcher who relies on the fastball, with a slide step, suppresses the running game. The runners’ prop prices reflect the average pitcher profile, but individual pitchers vary substantially.
The catcher’s role and the pop-time signal
Catcher pop time – the time from receiving a pitch to the throw arriving at second base – is one of the most predictive single stats for stolen base success. Top-tier catchers post pop times in the 1.85-1.95 second range. Mid-tier catchers post 1.95-2.05 seconds. Bottom-tier catchers post 2.05+ seconds. The difference between a 1.90 and a 2.05 pop time is enough to change the success rate on attempts by 15-20 percentage points.
The market knows this and prices for catcher quality, but catchers rotate. A team’s starting catcher might be in the lineup three out of four days, with a backup catcher with substantially worse arm strength behind the plate the fourth day. The market sometimes does not fully adjust to the lineup change. A pre-game stolen base prop priced as if the starting catcher is playing, when the announced lineup reveals the backup, can be value on the over side.
The other catcher consideration is throwing accuracy versus pop time. A catcher with a 1.88 pop time but a 75% throw-accuracy rate is less effective than a catcher with a 1.95 pop time and a 90% throw-accuracy rate. The market prices pop time more visibly than accuracy, which creates occasional gaps.
Catcher framing – the ability to convert borderline pitches into called strikes – also matters indirectly. A catcher who frames well allows the pitcher to throw more first-pitch strikes, which puts runners in less-aggressive count situations earlier. A catcher who frames poorly leads to more 2-1 and 3-1 counts where runners are more likely to attempt steals. The framing effect on running is real but indirect and small relative to pop time and arm strength.
The narrow but reliable edge in steal props
Stolen base props are not the place to make a primary MLB betting livelihood – the volume is limited, the line moves quickly when injury news drops, and the maximum stake sizes are typically capped. What they are is a niche market with consistent inefficiencies, where a research-driven bettor with attention to pitcher hold quality, catcher pop time, and game-state expectations can extract small but reliable edges. The edges are most pronounced on backup-catcher games and on speed-player matchups against pitchers with poor hold reputations. A disciplined bettor working these markets can add 1-3% to their overall MLB betting yield over a season, which is meaningful when stacked against the slimmer edges in moneylines and totals. The same applied discipline pays off in alternate run line markets, where the structural opportunities are different but the analytical approach overlaps directly.
How much did the 2023 rule changes shift stolen base totals?
League-wide stolen base success rates climbed from approximately 76% before the rule changes to approximately 80% after. Total stolen base attempts also rose substantially, with speed-tier players adding 40-60% more attempts per season. The new equilibrium has settled in over the seasons since.
Which input matters most for an anytime steal prop?
Pitcher hold quality and catcher pop time together drive the largest single chunk of the line. A speed runner facing a pitcher with poor holding and a catcher with a slow pop time can carry implied probability 15-20 percentage points higher than the same runner against an elite pitcher and catcher tandem.
This material was created by the DiamondEdge team.
Related posts

MLB Betting and UK Tax: What Punters Actually Need to Know

MLB Public vs Sharp Money: Reading the Line Movement